Part B
Directions:
Write an essay based on the following chart. In your writing, you should
1) interpret the chart, and
2) give your comments.
You should write about 150 words on the ANSWER SHEET.

![]()
Part B
审题
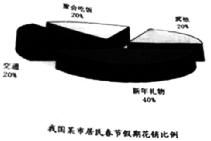
该饼形图显示了某城市人口在春节期间的花费比例,其中人们在新年礼物上的消费最多,其中有诸多原因,如人民生活水平的提高和改善。理由分析合理即可。
行文
范文
The pie chart above, the distribution of expense during the Spring Festival in a certain city in China, consist of 4 parts, which are food, transportation, others and gifts. Among the expense, food, transportation and others account for 20% respectively. By comparison, the New Year's gift is in the lead, amounts to 40%.
There seems to be two elements involved in this phenomenon that people spend so much on gifts. To begin with, it is universally acknowledged that the Spring Festival is the most important festival in our nation during which most people will buy gifts for their families and friends. In addition, our society is sparing no efforts to produce a brand¬new concept that one's social status is associated tightly with the gifts we send to others, which can also show his or her property.
To sum up,this trend is likely to continue for quite a long time in the future. What we can do is to present gifts in a rational way—not too much emphasis on the value of gifts, rather than the respect and love the presents convey.


